Charters top public
schools on exam
Isle charter students are grouped
together for the comparison
sessoyan@starbulletin.com
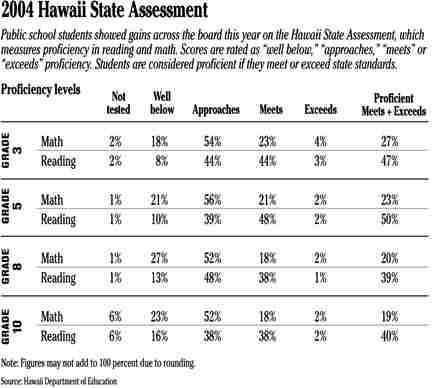
Students in Hawaii's charter schools scored higher on this year's Hawaii State Assessment than their peers in regular public schools, except for eighth-graders, according to a breakdown of results released yesterday.
This is the first time that test data for all Hawaii charter schools were grouped as one district and could be compared with the state average. Charter schools serve just 2 percent of public school students in Hawaii, 4,520 out of the 182,430 children in public school when the tests were given in the spring.
"We're really happy with the results," said Steve Hirakami, interim executive director of the Charter Schools Administrative Office. "That kind of validates the charter schools. Across the board we did really well."
The Hawaii data contrast with a recent New York Times report that analyzed results of a different test, the 2003 National Assessment of Educational Progress, and concluded that charter students nationwide generally did worse than comparable students in regular public schools. U.S. Education Secretary Rod Paige denounced that report as flawed.
Charter schools are public schools that have their own school boards and operate under a charter, or contract, with the state giving them more autonomy over their affairs. They are designed to provide alternatives to the regular public schools.
The new Hawaii data were made public as part of the school-by-school test scores for the 2004 Hawaii State Assessment and the SAT 9, which were presented to a Board of Education meeting yesterday in Lihue, Kauai. The tests were given statewide in grades 3, 5, 8 and 10.

|
"The only reason this is notable is the recent New York Times article that said nationwide charter schools were lagging behind," Susan Deuber, principal of Voyager School in Kakaako, said in an interview. "I'm not sure that it's fair to compare, but unfortunately that's already happened. So the fact that we do have some data that says that's not what's happening locally, that's a thing we should all celebrate."
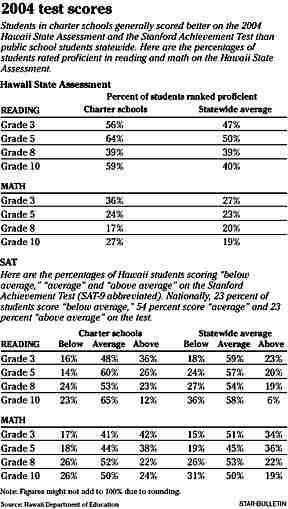
The spread among test scores between charter and other schools varied from grade to grade. In third grade, 56 percent of charter school students were proficient in reading on the HSA compared with 47 percent in traditional schools, while 36 percent of charter students were proficient in math compared with 27 percent for regular public schools.
In fifth grade, charter school students outperformed their peers in reading, with 64 percent proficient compared with 50 percent, but were almost identical in math, at 24 percent proficient in charters and 23 percent in math.
In eighth grade, more regular public school students were proficient in math than charter students, 20 percent to 17 percent, and in reading the two groups were equal at 39 percent. Among sophomores, 59 percent were proficient in reading compared with 40 percent in regular schools, and 27 percent were proficient in math compared with 19 percent in regular public schools.

|
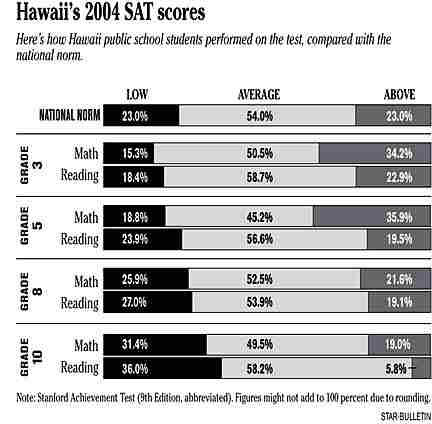
On the Stanford Achievement Test, more charter school students scored "above average" than the statewide percentage at all grade levels, with the lower grades performing especially well.
The multiple-choice SAT allows parents to gauge students compared with a national norm. But the results of the Hawaii State Assessment, which requires students to show critical thinking and explain their reasoning, are used to determine whether a school meets academic benchmarks under the federal No Child Left Behind law.
Like regular public schools, charter school test results varied widely from campus to campus. Educators note that variations in tests scores often reflect the fact that schools serve different populations. Socioeconomic status, for example, is strongly associated with academic performance. Poor students tend to enter school less prepared and lag academically behind those in wealthy areas.
In Hawaii, students in charter schools -- taken as a group -- tend to have higher household incomes than those in regular public schools. In the 2003-2004 school year, 36 percent of students in charter schools were eligible for subsidized lunch because of low family incomes, compared with 43 percent of public school students statewide, according to Keith Kameoka, a specialist in the Information Resource Management Branch of the state Department of Education.

|
Charter schools in Hawaii are a diverse lot. Many are small start-ups focused on Hawaiian language and culture, which often serve at-risk students. Others are traditional schools such as Lanikai and Waialae elementary schools, which converted to charter status. The top performer among them is the Education Laboratory, formerly the University of Hawaii Lab School.
Greg Knudsen, spokesman for the Department of Education, said officials will analyze the data further in hopes of drawing lessons that could be applied statewide to help regular public schools improve.
"We need to learn something from the charter schools," he said. "We need to look at those who are serving special enrollments, and if they are having more success in reaching those students, we would want to apply it in the regular schools."
Selvin Chin-Chance, head of the department's Test Development Section, noted that several big charter schools weighed heavily in the results for the 26 charter schools statewide that took the test last year.
"The statistics are dominated by a handful of schools that proportionately command a very high percentage of the student population," he said. "You have to be very careful in making any interpretation, whether it's good or bad."
Hirakami said the smaller class size in charter schools might have contributed to the results. He was reluctant to compare schools based on test scores, saying it is more valuable to look at improvement over time for students and measure success by broader criteria.
"When you look at test scores, it's too black and white for me," he said, "and too easy to come to stereotypical conclusions."
PDF and spreadsheet format
on its Web site at:
lilinote.k12.hi.us/STATE/COMM/ DOEPRESS.NSF/
a1d7af052e94dd120a2561f7000a037c/
5a9edbaf5c17d56d0a256f0300697413?OpenDocument